Phase Analysis
Phase analysis is a key tool in checking the health of machines by looking at their vibrations. It measures how the timing of vibration signals line up with each other, usually from different parts of a machine. This helps find problems like parts not lining up right, balance issues, parts being loose, or gear problems. This guide will cover the basics of phase analysis, why it’s important, how to measure it, and how it helps find common machine issues.
Understanding Phase Analysis
In the context of vibration analysis, “phase” refers to the measurement of the relative position of one vibrating component with respect to another over time, expressed in degrees of a circle. It’s a way to describe how synchronized (or out of sync) vibrations are between different points on a machine or between a machine component and a reference signal.
Why Phase Analysis Matters
Phase analysis helps spot certain mechanical problems not visible through just looking at signal strength. By understanding the movement relation, maintenance teams can more accurately find the source of vibration problems. This precise diagnosis is key to fixing machines efficiently, cutting downtime, and making machines last longer.
Phase analysis is great for finding several machine problems, such as:
- Misalignment: It can spot when shafts don’t line up correctly, which can wear out bearings and couplings faster.
- Imbalance: It identifies if rotating parts are not balanced by looking at the phase difference between horizontal and vertical vibrations.
- Looseness: Changes in phase at different frequencies can show if there are loose parts or weak foundations.
- Gear Problems: It can find issues like worn or damaged gear teeth by looking at the phase timing between the gear mesh frequency and its harmonics.
How to do Phase Analysis
The goal of the analysis is to find the phase between Horizontal and Vertical vibration, or any other direction.
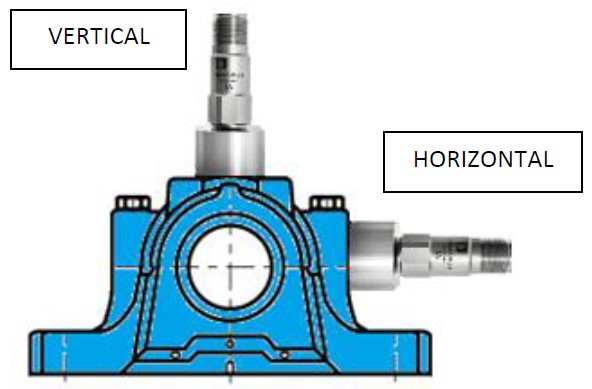
DigivibeMX has 3 ways to determine phase between 2 vibrations :
- Phase shift function (graphic method)
- Phase by frequencies (numerical method)
- Phase using ODS route’s data
Phase Measurement
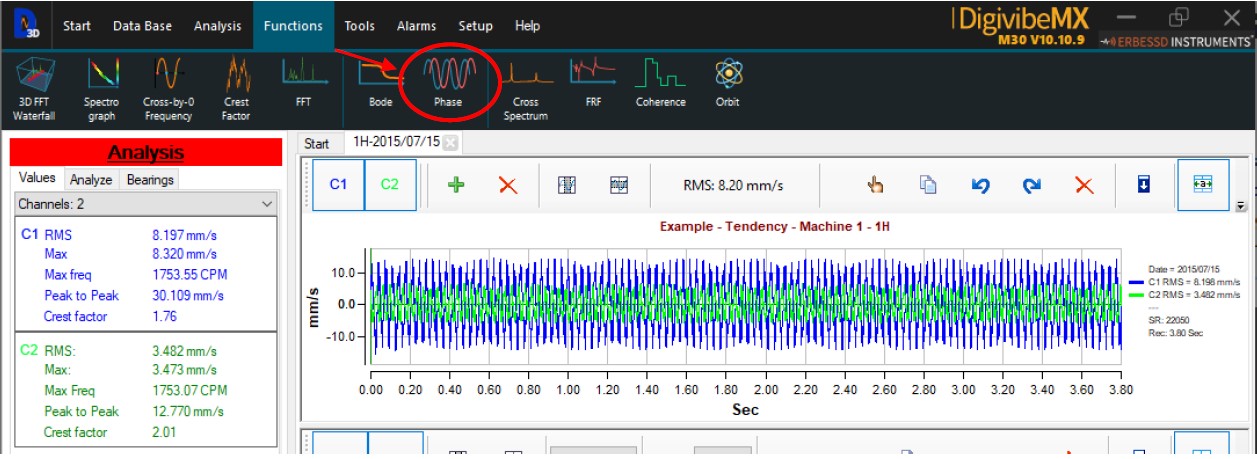
Start a New Analisis and record 3s (or more) with 2 Channels or open 2 signals recorded simultaneously:

You can also open 2 signals recorded simultaneously. Go to « Functions » and select « Phase » :
Choose Channel 1 as Reference to be phase 0° (or choose Ch2 as Reference) and click Ok :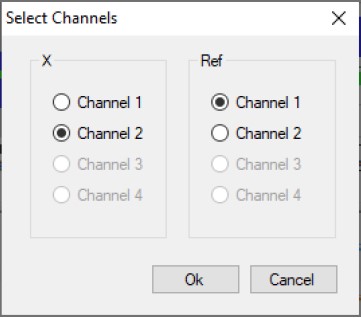
We get this graphic, now we zoom-in to the frequency we are interested in, in this case 1754 CPM :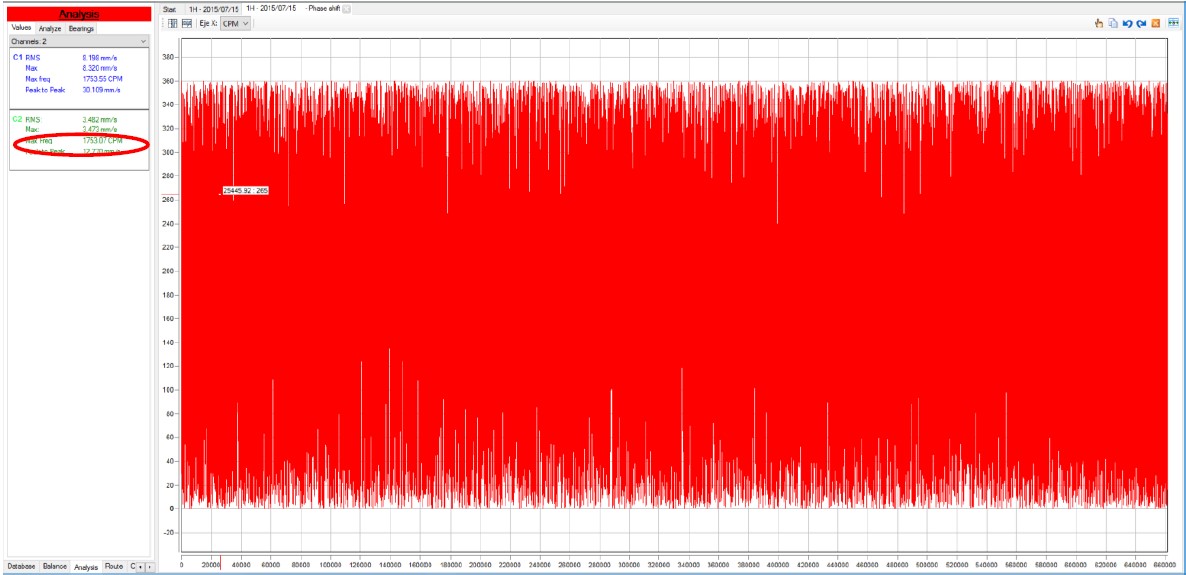
The phase in this frequency is 226°. You can place a Marker and Copy the graph to include it in your report :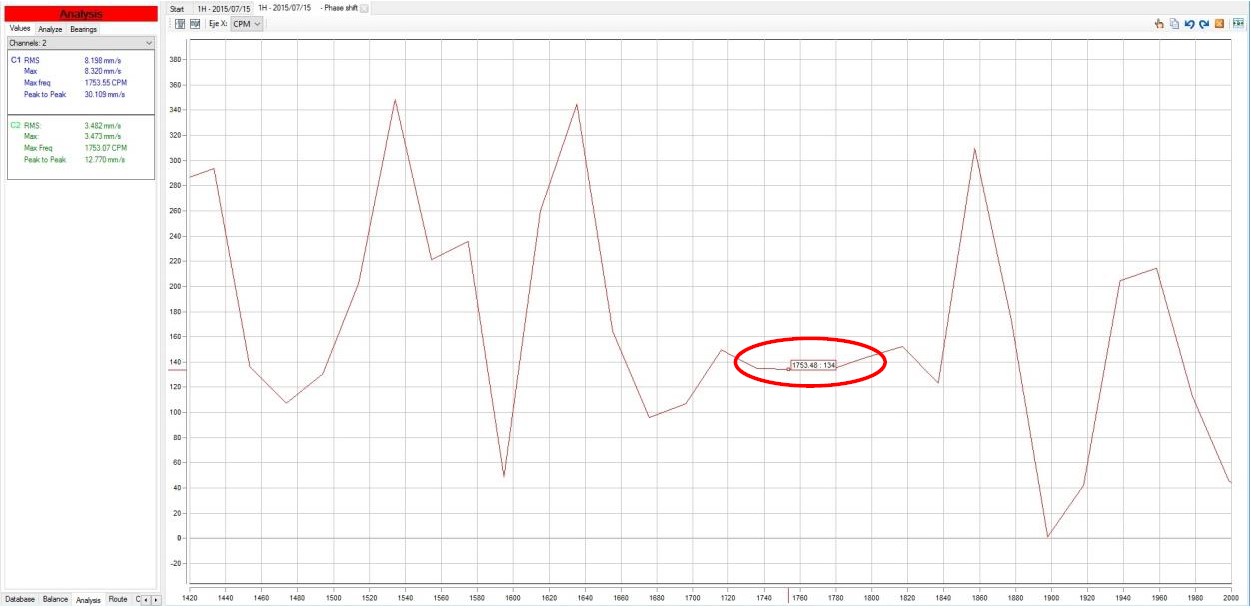
Phase by Frequencies
After you record 2 signals simultaneously or if you have the signals stored in the database after doing a route with reference point, from Machine 1 select Point 1 – Horizontal as Channel 1:
IMPORTANT :
If the 2 signals were NOT recorded at the same time or using Reference point (like in routes with 2 accelerometers selecting the Reference F), then the phase between the 2 signals is not valid.
Now add the 2nd signal :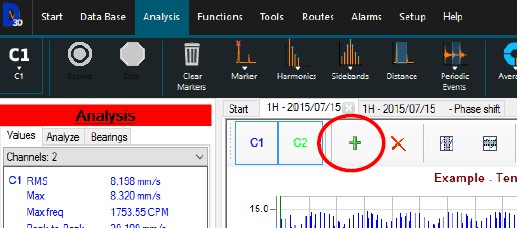
Point 1 – Vertical direction as Channel 2:
Click Ok :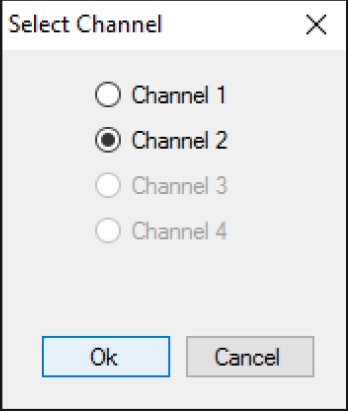
Now select Analysis tab on the bottom: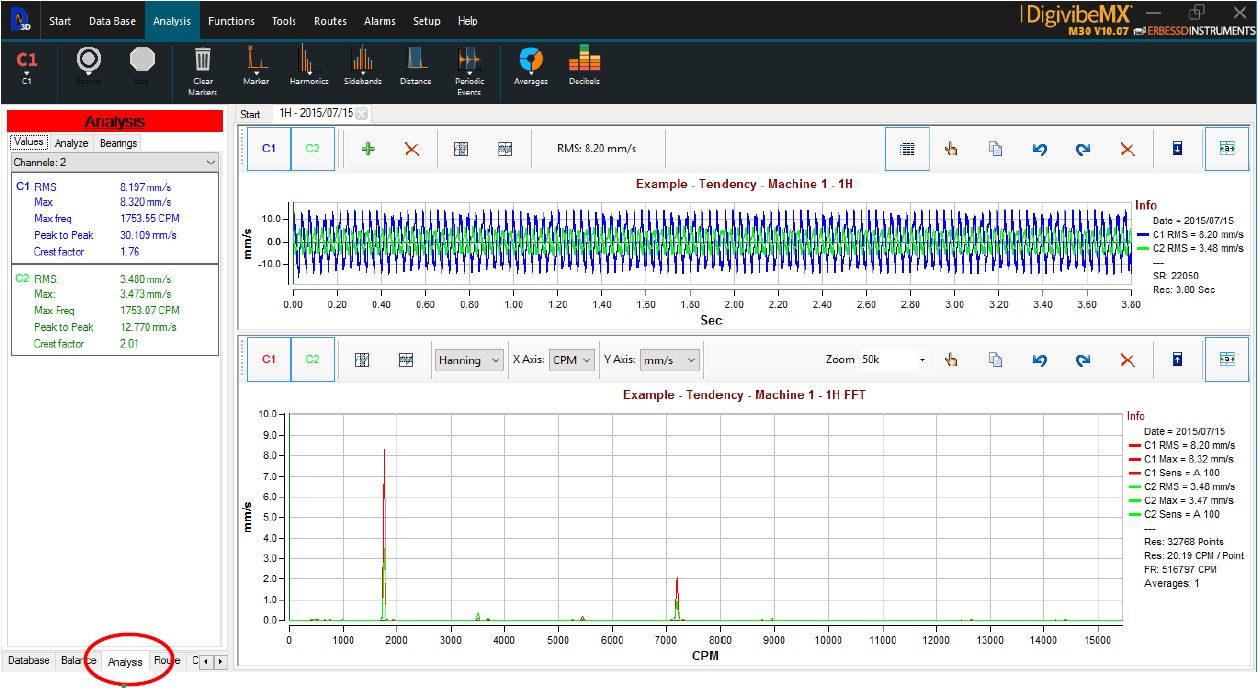
Then Analyze tab on the top: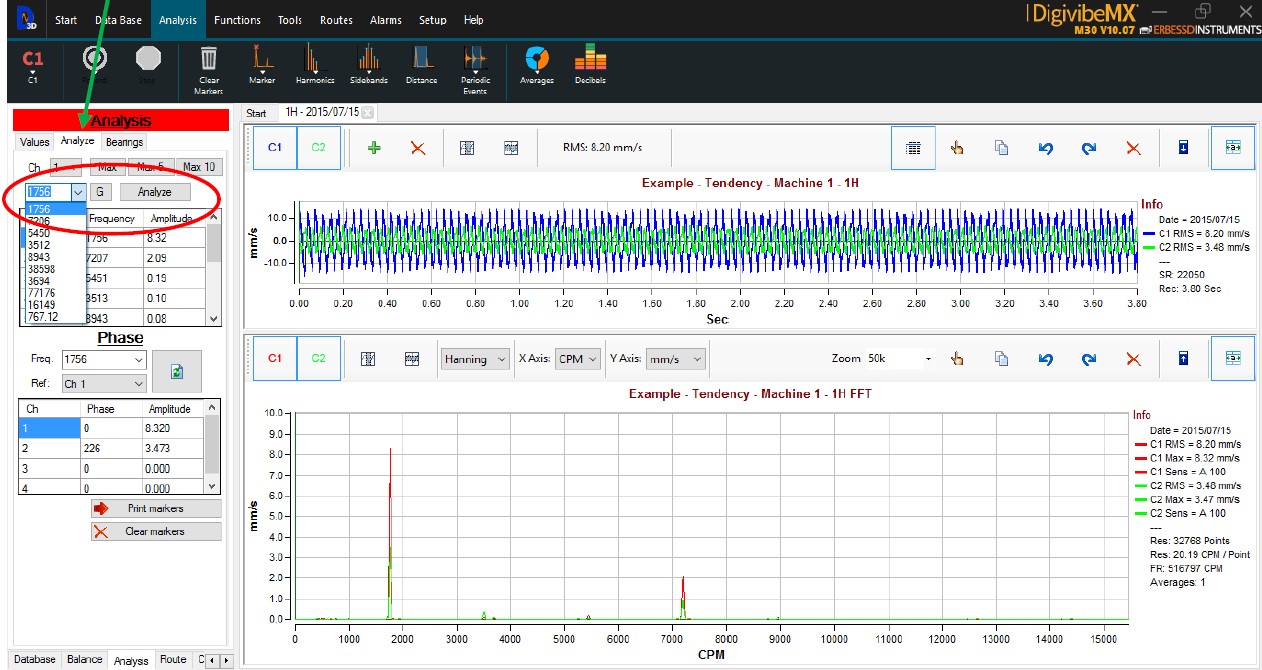
Choose the CPM, the Channel as reference (in this case Channel 1) and the table shows the phase between the 2 signals, using the reference channel as Phase 0°.
In this example, the phase between Channel 1 and Channel 2 is : 226°
You can locate the markers on the graph: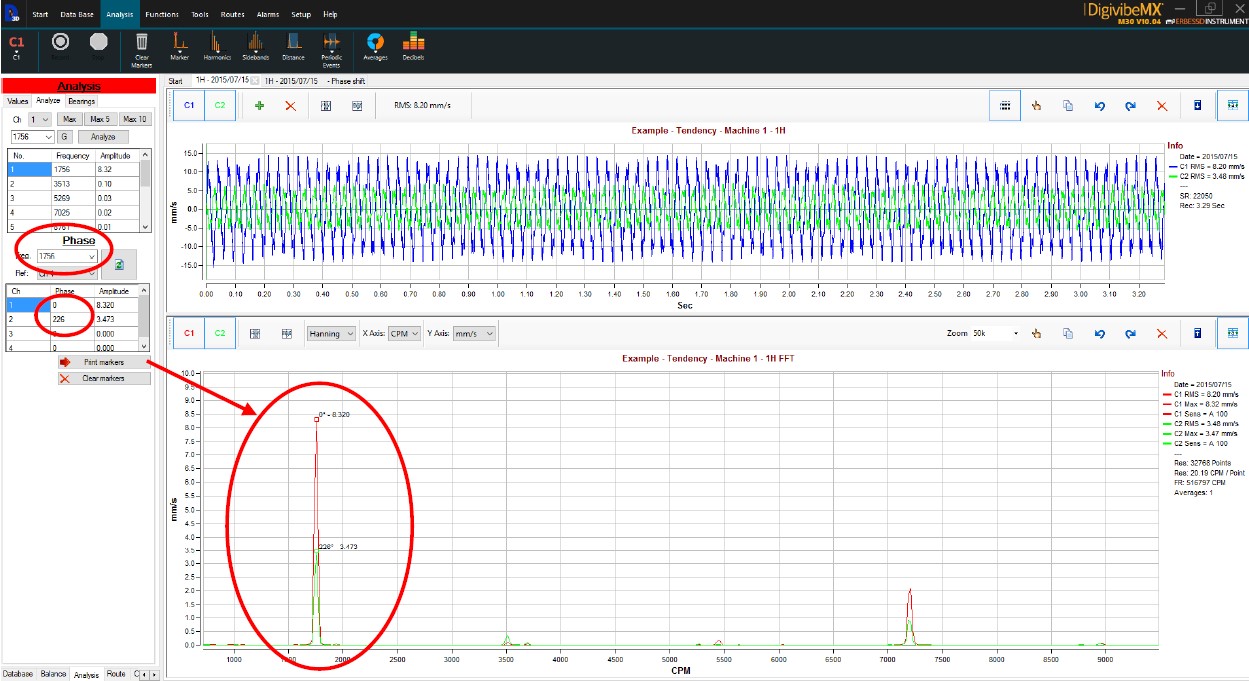
You can choose other frequencies at the same time and place the markers: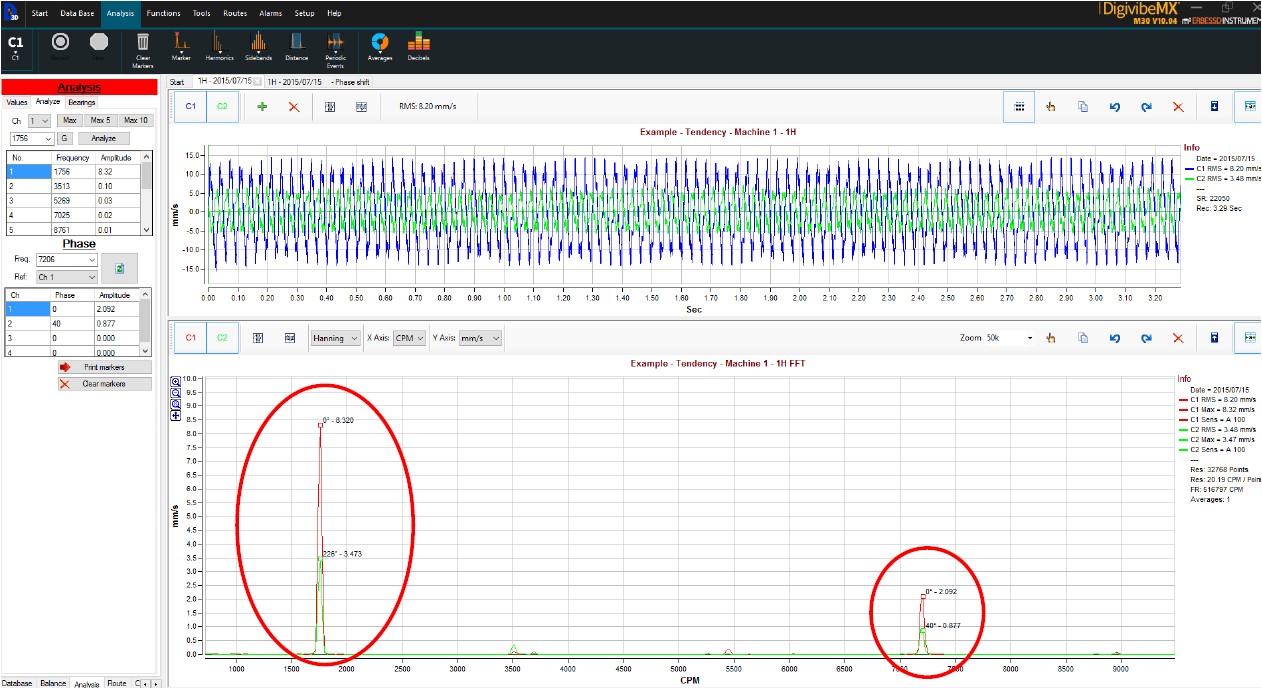
You can copy the graphics (right button on the graph) to include it on your report.
Phase using the data of an ODS route
After the Route with Reference point is finished, select the machine and start the « ODS 3D » function :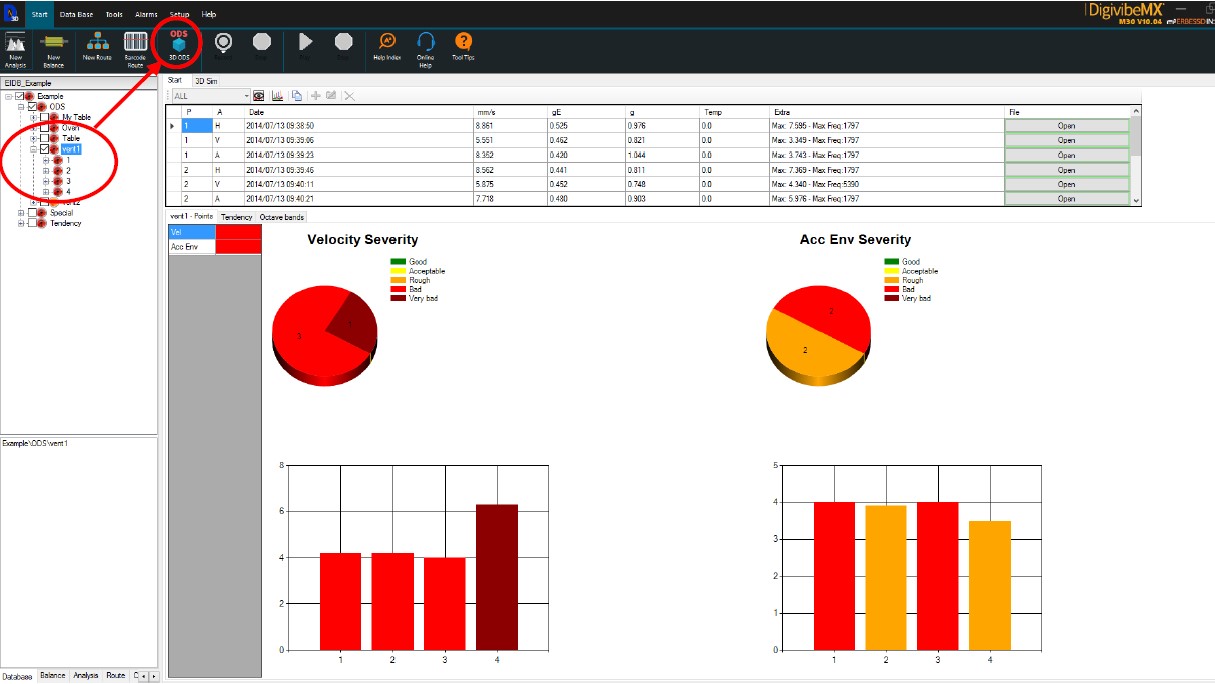
Select the route and the RPM for the phase analysis :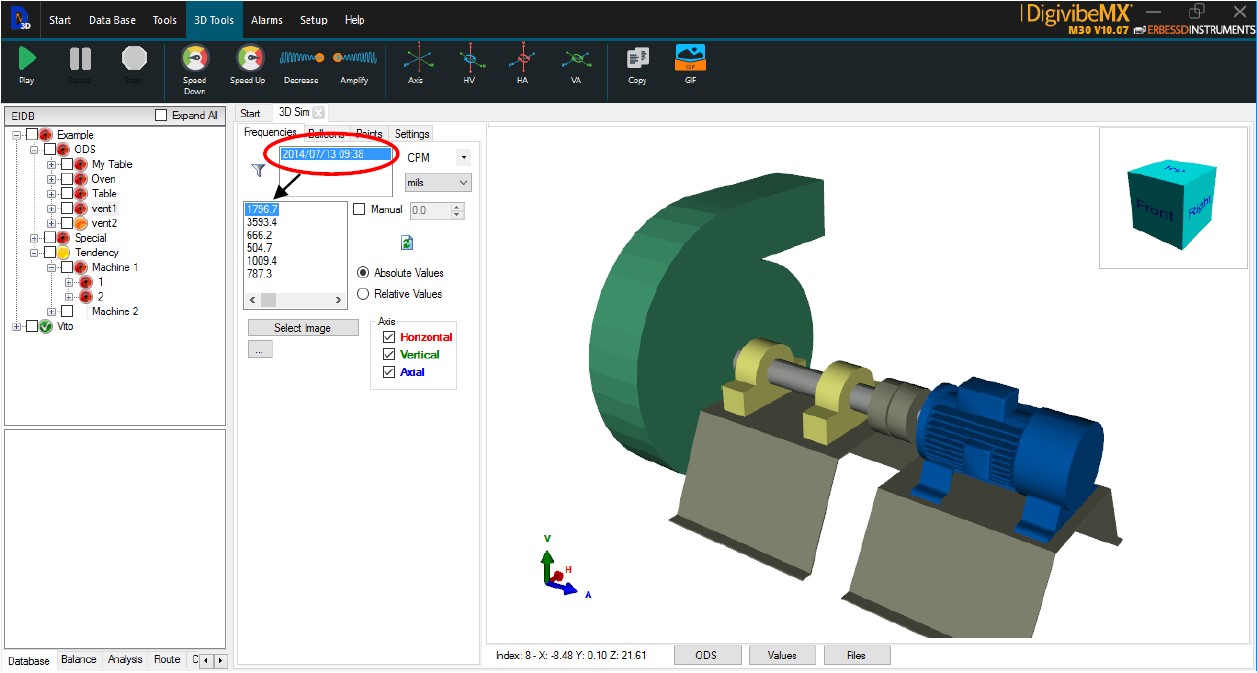
Select « Points » and click on the point you wish to analyze :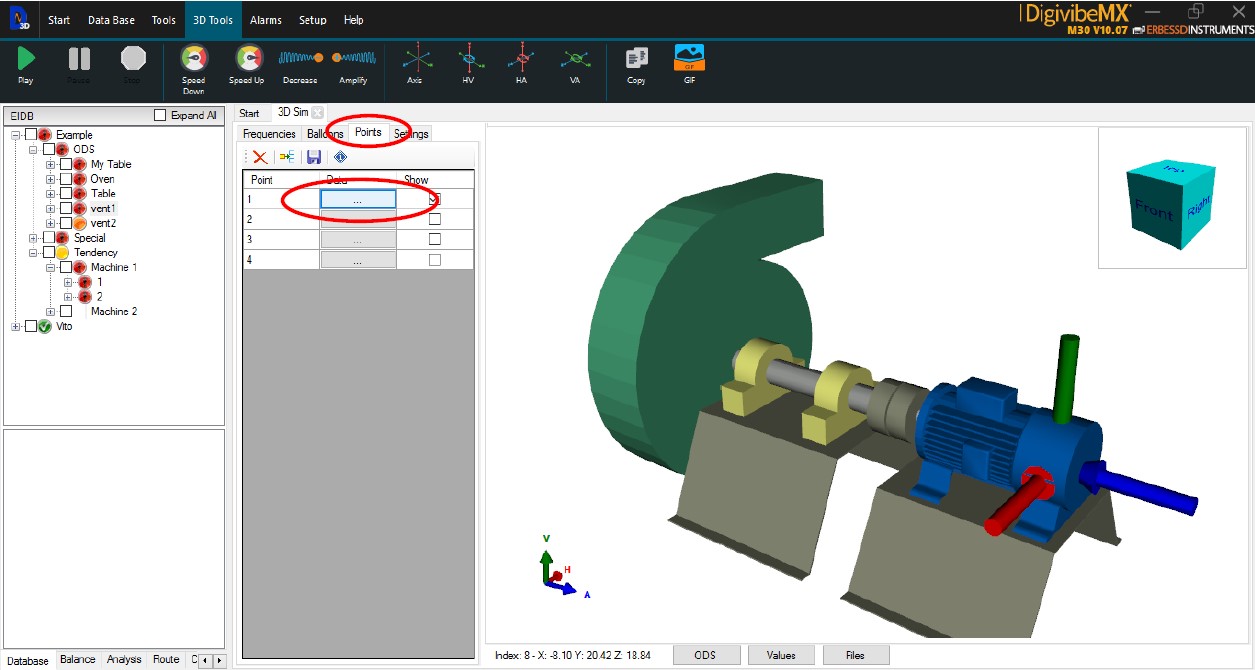
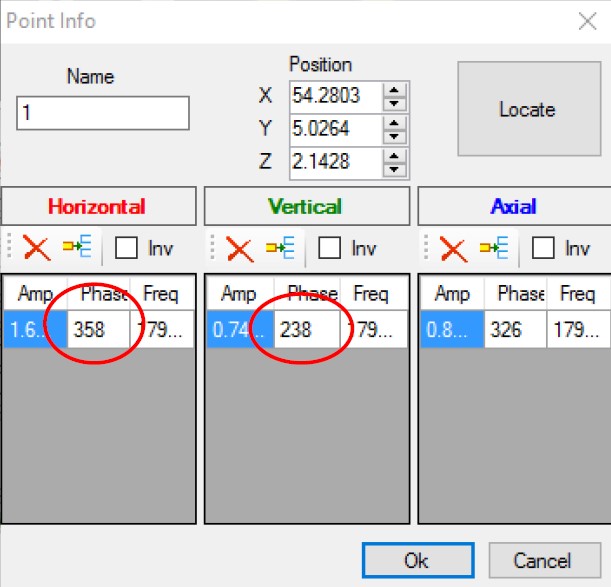
3 phases are calculated from the Reference point :
- Horizontal
- Vertical
- Axial
Rest the phase from one direction to another and you have the phase shift between the 2 directions.
IMPORTANT : Make sure that the vibration measurements were taken on the exact directions shown by the arrows on the 3D model, otherwise check the « Inv » box to invert the arrow.